Area Odds
Trading is all about increasing your odds and gaining a edge in the markets. The more of an edge you can gain the hight the chance you will be able to predict when there’s a opportunity.
There area pattens in the market that happen over end over and new pattens happening everyday. It’s our job to identify those pattens and use it to our advantage.
So, lets talk about support and resistance. Now out of all the hacks i gave you over the last few days this one its the most popular or know hack of them all but still most don’t explain it right.
So here we go… A (support/resistance) area is an area in witch the charts price action have historically made long moves to and from.
In these areas price has a higher chance of going from one (support/resistance) area all the way to another (support/resistance) weather thats up or down.
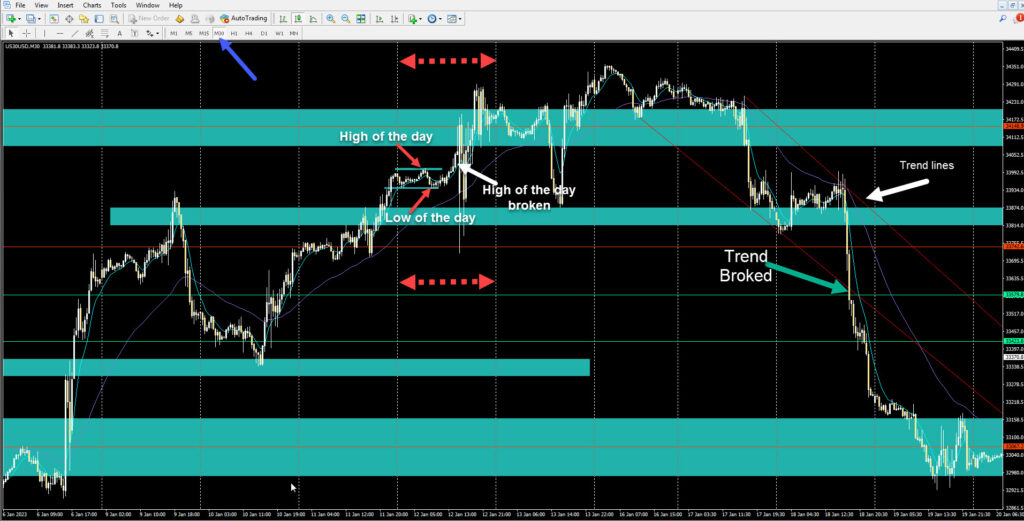
(the Greenish blue high lighted area examples.)
These (support/resistance) areas can be found on smaller time frames like the (5 min) chart all the way up to the larger ones like the (Daily) chart time frame.
Most times when price is in these areas it hangs around for a wile sometimes for days, going up and down until it’s ready to make it’s full move. Depending on what kind of trader you are determines what time frames would me more useful for you.
But still, it’s our job to learn the pair that we are trading so we can identify when that move is likely to happen. We never know which direction the market’s going to go, we just wait for it to show us signals.
Also, new support/resistance areas are being created everyday on smaller time frames for each pair being traded so it’s also important to pay attention to new found support/resistance as you move along.
Remember (support/resistance) is an area not a line so don’t expect it to exact and also don’t expect it to always go all the way to the next (support/resistance) area with every trade. It’s just another guide to help us on out trading journey.